Households

There are 130,246 households with residents in Sandwell.  The average household size in Sandwell is 2.42, which slightly above the England & Wales average of 2.4.

  • 339,791 Sandwell residents live in households, whilst 2,041 live in communal establishments (managed residential establishments).
  •  

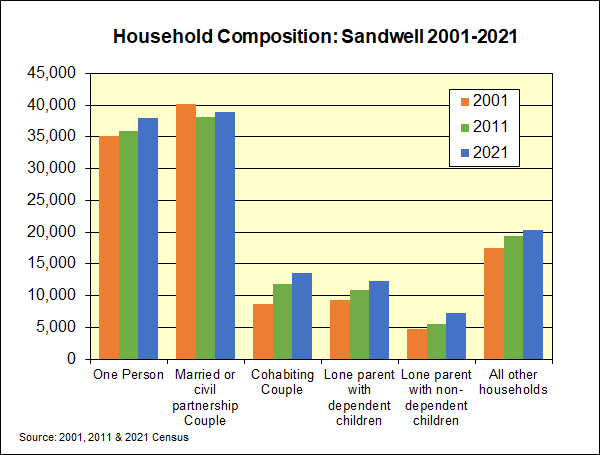
    In terms of household composition, in 2021, 38,042 households in Sandwell are made up of only one person.

  • There has been an increase of 2.0% in the number of married or civil partnership couple households since 2011, whilst there has been a large percentage increase in the number of cohabiting couple households (+15.8%).
  • The proportion of lone parent households (with dependent children) has increased from 9.0% in 2011 to 9.4% in 2021. Sandwell ranks 15th out of 331 Local Authorities on this indicator.
  • There has also been a large rise in the number of lone parents with non-dependent children (+31.4%), although these only account for 5.5% of all households.
  •  

    62.1 % of households in Sandwell are deprived in at least one dimension or measure of household deprivation (compared with 51.7% in England & Wales); this number has decreased since 2011, when it was 69.5%.
    Household change since 2011

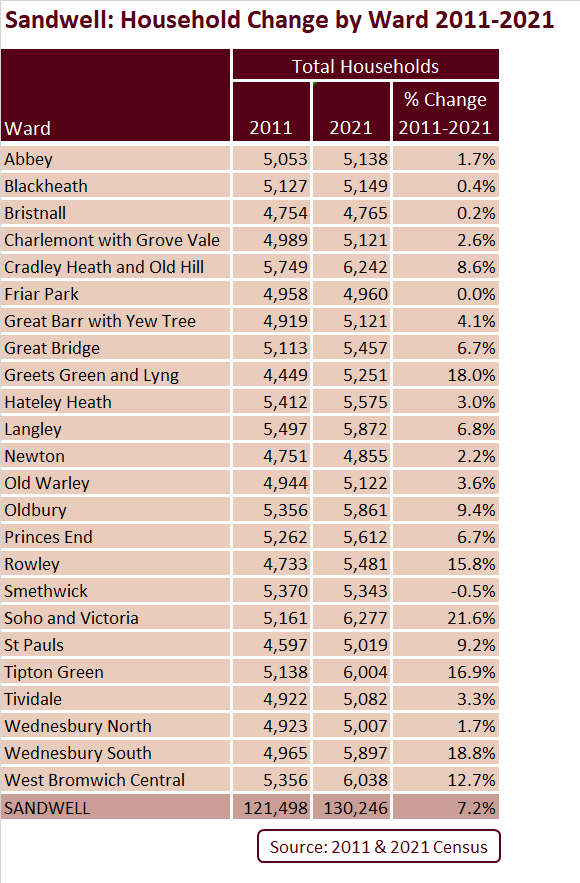
    Since 2011, Sandwell overall has seen an increase of 7.2% in the number of households. According to the 2021 Census, the ward with the largest number of households is Soho & Victoria (6,277), whilst the smallest is Bristnall (4,765).

  • Only one ward has seen a fall in the number of households - Smethwick (-0.5%). This is despite the ward seeing an increase in population.
  • Six wards have seen an increase of more than 10% in the number of households since 2011. The rise is particularly high in Soho & Victoria, Wednesbury South, and Greets Green & Lyng (at 21.6%, 18.8% and 18.0% respectively).  Soho & Victoria also saw a large increase between 2001 & 2011.
  • Housing and Car Ownership

  • Across Sandwell, 80.8% (105,160) of households lived in a house or bungalow, 19.1% (25,000) lived in a flat, maisonette or apartment and 0.1% (90) lived in a caravan, or other mobile or temporary structure. This compares with 77.9%, 21.7% and 0.4% respectively in England & Wales.
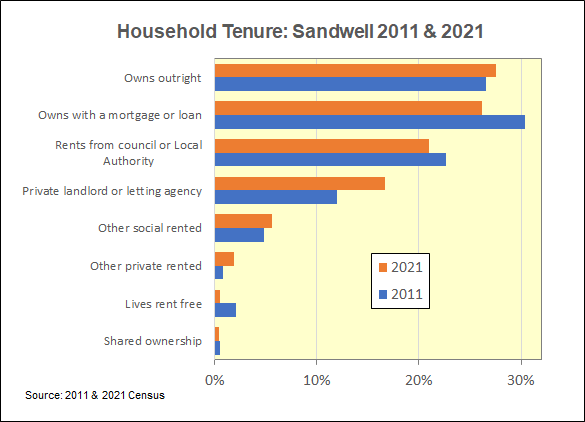
  • In 2021, 54.2% (70,635) of households owned the accommodation they lived in, compared with 62.5% in England & Wales. 45.2% (58,850) rented their accommodation and 0.6% (760) of households lived rent free (this compares with 37.3% and 0.1% respectively in England & Wales).
  • 21.0% of Sandwell households rent their accommodation from the Local Authority, compared with 8.3% in England & Wales.
  • There has been an 18.1% increase in the number of households with fewer bedrooms than required – 7.4% (9,630) in 2021 compared with 6.7% (8,160) in 2011. Across England and Wales, this proportion had decreased slightly (4.3% in 2021 compared with 4.5% in 2011).
  • Almost all Sandwell households reported that they had central heating in 2021 (98.2%); of these, 0.3% used at least one renewable energy source (compared with 0.9% in England & Wales).
  • In 2021, 29.2% (38,090) of Sandwell households had no cars or vans (down from 33.9%, 41,200 in 2011). This compares with 23.3% in England & Wales in 2021.