In 2021, 57.3% (195,620) of usual residents in Sandwell identified their ethnic group within the high-level "White" category, compared with 81.7% in England & Wales. Sandwell has seen a decrease from 69.9% in the 2011 Census.
As part of the "White" ethnic group, 52.1% (177,930) of the total population in Sandwell identified their ethnic group as "English, Welsh, Scottish, Northern Irish or British" (compared with 74.4% in England & Wales), this is a continued decrease from 65.8% in 2011, and from 78.0% who identified this way in 2001.
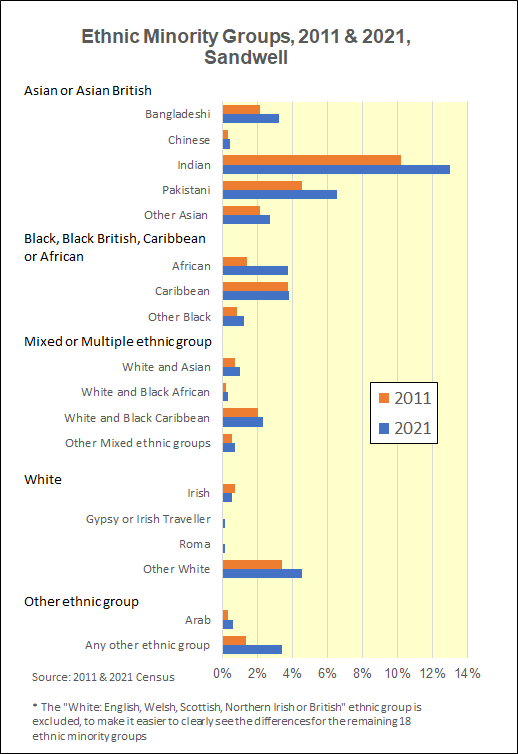
The next most common high-level ethnic group was "Asian or Asian British" accounting for 25.8% (88,020) of the overall population, this ethnic group also saw the largest percentage point increase from 2011, up from 19.2% (59,260 people).
Across the 19 ethnic groups, large changes were seen in the numbers of people identifying their ethnic group as "Other ethnic group: Any other ethnic group" (3.4%, 11,710 in 2021, up from 1.3%, 3,880 in 2011), and " Black, Black British, Caribbean or African: African" (3.7%, 12,670 in 2021, up from 1.4%, 4,400).
In Sandwell, 10.6% (13,840) of households consisted of members identifying with two or more different ethnic groups, an increase from 9.1% (11,035) in 2011.
Where respondents selected they identified as one of the “other” ethnic groups within each broad category, they were able to write in their ethnicity. This has enabled ONS to produce a detailed ethnic group classification, providing insight for 287 ethnic groups.
In Sandwell, the largest of these groups in 2021 are “Sikh”, accounting for 2.3% of the population, and “Polish” (1.7%).
In 2021, 83.6% (274, 710) of Sandwell usual residents, aged three years and over, had English as a main language, compared with 91.1% in England & Wales. The Sandwell figure is down from 88.0% in 2011.
In 2021, a further 5.2% (17,230) of the overall population were proficient in English (saying they speak it very well) but did not speak it as their main language.
The most common main languages spoken in Sandwell, other than English were: Panjabi (6.4%), Polish (1.7%), Bengali (1.0%) and Urdu (1.0%).
The largest increase was for people who specified Punjabi as a main language, who accounted for 6.4% (20,980) of usual residents in 2021, up from 4.3% (12,520) in 2011.
In 2021, 11.3% (14,750) of households consisted of members who had different main languages.


