2011 Census: Ethnicity - Country of birth, Language and Religion
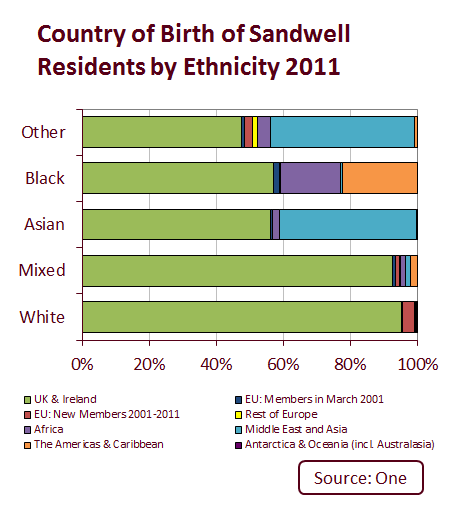
Country of birth
When considering country of birth, 84.6% of Sandwell residents were born in the United Kingdom or Ireland, compared with 87.3% nationally. One in eight Sandwell residents were born in a country outside the European Union. Only 1.5% of Sandwell's residents have lived in the United Kingdom for less than 2 years and a further 2.3% have lived in the UK for between 2 and 5 years.
Over 95% of Sandwell's White residents were born in the United Kingdom or Ireland, whilst 3.6% were born in EU Accession countries (which joined the EU between April 2001 and March 2011).
Detailed country of birth data can be downloaded here for Sandwell wards.
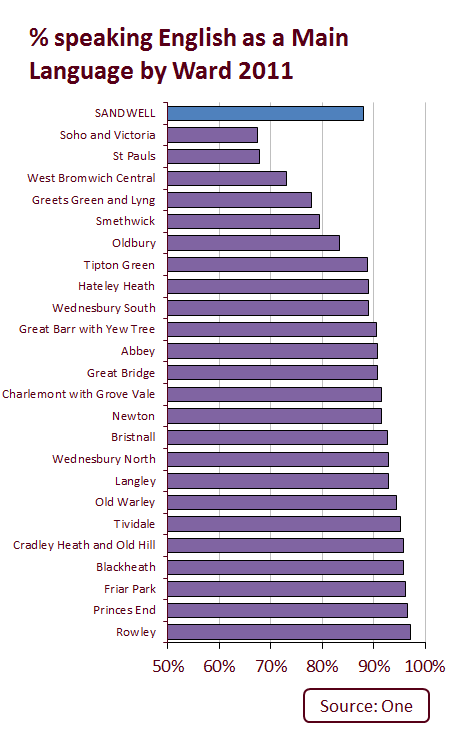
Language
The 2011 Census collected information for the first time on main language and English language skills. It should be noted that people who did not report English as a main language may be fluent English speakers.
In Sandwell overall, 64.5% of residents whose main language is not English, can speak English well or very well. Only a very small proportion of residents cannot speak English at all (0.8% of all residents aged 3 & over).
88% of Sandwell residents speak English as their main language, compared to 92.3% nationally. This proportion varies by ward, and in five wards less than 80% of residents speak English as their main language.
7.4% of Sandwell residents speak a South Asian language as their main language. Over a quarter of St. Pauls residents speak a South Asian language overall.
8.7% of residents in West Bromwich Central speak another European Union language. In particular, 7.1% of residents speak Polish as their main language.
More data on languages spoken by ward can be downloaded here, and detailed data for Sandwell is also available.
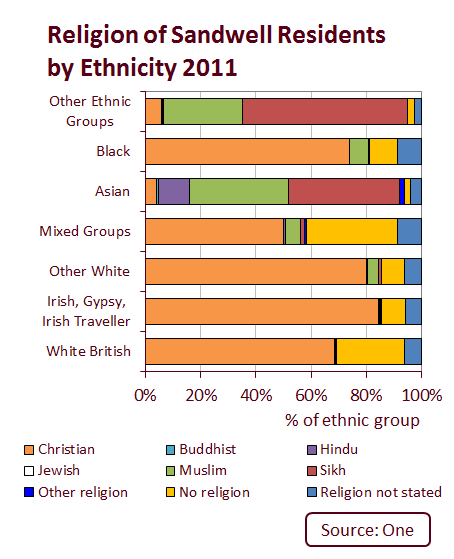
Religion
In terms of religion, 55.2% of Sandwell residents are Christian, lower than the national average of 59.3%. This has fallen considerably since 2001, when 68.6% of Sandwell residents said they were Christian. Overall, 18.7% said they are not affiliated with any religion.
Detailed data on religion by ethnicity by ward can be downloaded here.