Ethnicity by Age and Household Composition
Age
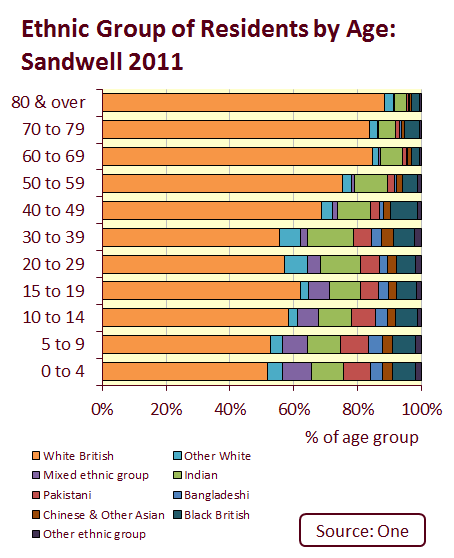
A breakdown of ethnicity by age for Sandwell is available here, and is summarised in the graph.
The ethnicity profile of the various age groups in Sandwell are markedly different.
Older age groups are largely White, with all age bands over the age of 60 being over 80% White origin. For instance, 93% of those aged 85 & over are White, and 90.9% are White British. The next largest ethnic group of this age is those of Indian origin (3.4%).
Considering the age profile of the different ethnic groups, there are a few key points of note:
Ethnicity by age data is also available for Sandwell wards.

Household composition
There are 121,498 households with residents in Sandwell, a rise of 5.3% since 2001. The average household size in Sandwell is 2.5, which ranks 19th in England & Wales out of 348 Local Authorities (where 1 is highest). In terms of household composition, in 2011, 35,935 households in Sandwell are made up of only one person.
73% of households in Sandwell are headed by a White British resident, however this varies by ward. In Soho & Victoria only 26.7% of households are headed by someone who is White British compared with 91.8% in Rowley. 7.7% of households in Sandwell have an Indian head - this is the case in over a fifth of households in St. Pauls.
A spreadsheet of household type by ethnicity by ward can be downloaded here.


